


Product function
-
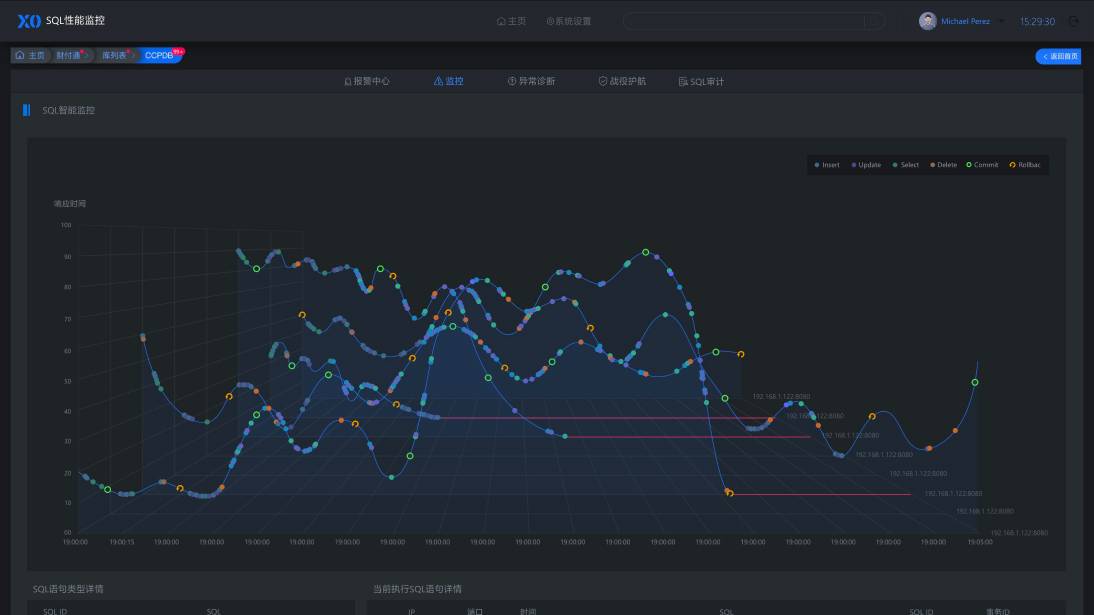
 Performance monitoring
 Resource monitoring
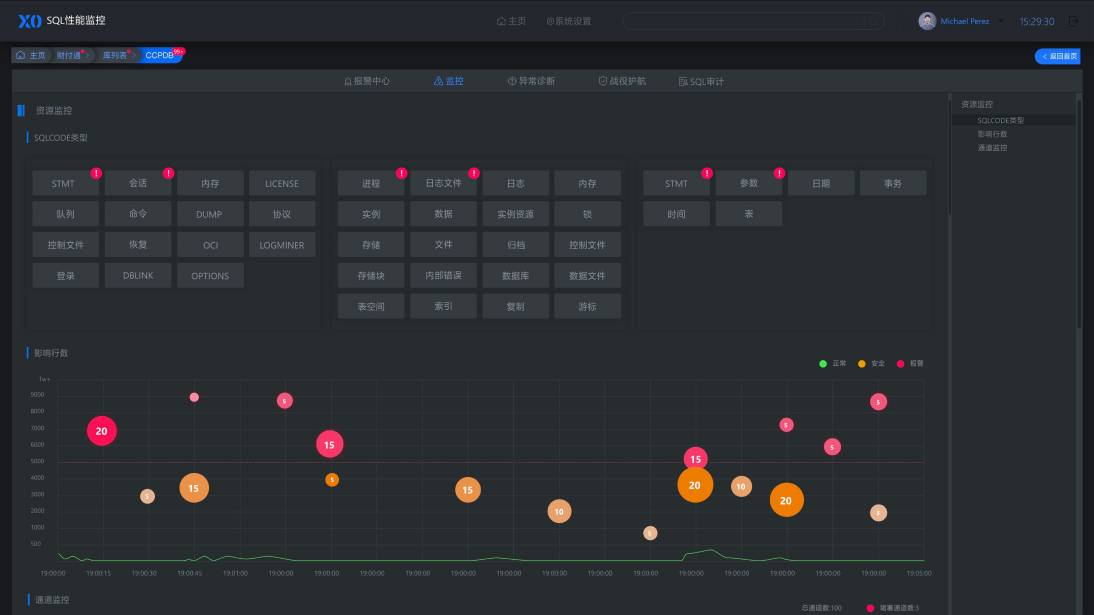
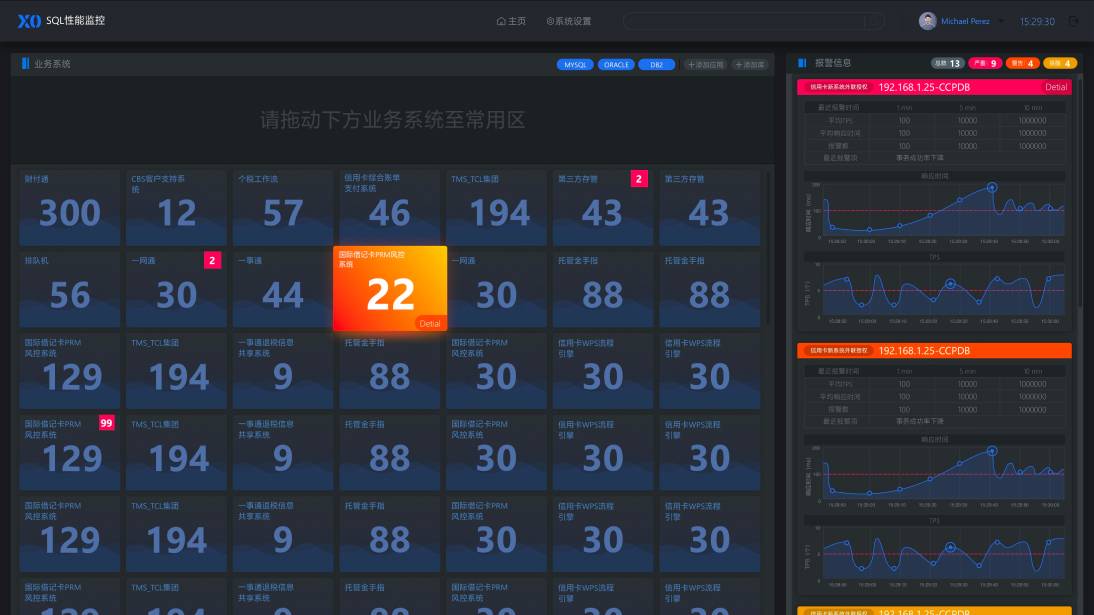
 Node monitoring
 -
- 01
- 02
- 03
- 04
- 05
- 06
- 07
- 08
TPSNumber of transactions per second (number of transactions), set threshold alarm for TPS.RSPTAverage response time of SQL statements in the database, and set threshold alarm for RSPT.Response rateThe response proportion of the database and the response rate threshold alarm.Output rateThe normal response proportion of the database can represent the service capacity of the database.Proportion of abnormal sqlcodeThe percentage of SQL statements that failed to execute in the total executed SQL.Rollback rateThe ratio of transactions executing rollback to total transactions.Slow SQL statementThe database executes the slowest SQL statement of TOP10.Uncommitted transactionsThe total number of uncommitted transactions in the current database. -
- 01
- 02
- 03
- 04
- 05
“hang”Status monitoringThe database is not responding.“down”Status monitoringThe database is down or the application has not been requested for a long time.“Bump”Status monitoringDatabase response time and its instability.“Inferior”Status monitoringThe draw response time of the database tends to slow down.“Slow”Status monitoringThe average response time of the database is greater than 1s. - 4
-
- 01
- 02
- 03
- 04
- 05
SQLCODEclassificationClassify and monitor the return codes of failed SQL statements.Affect row count monitoringThe number of records in the SQL statement operation table.High risk statement monitoringDDL statements, such as create, alter,...Channel not submitted for monitoringThe application under the same connection has not executed commit / rollback for a long time.Channel not responding to monitoringThe database has not answered for a long time under the same connection.
- 1
-
- 01
- 02
- 03
- 04
- 05
- 06
- 07
- 08
- 09
- 10
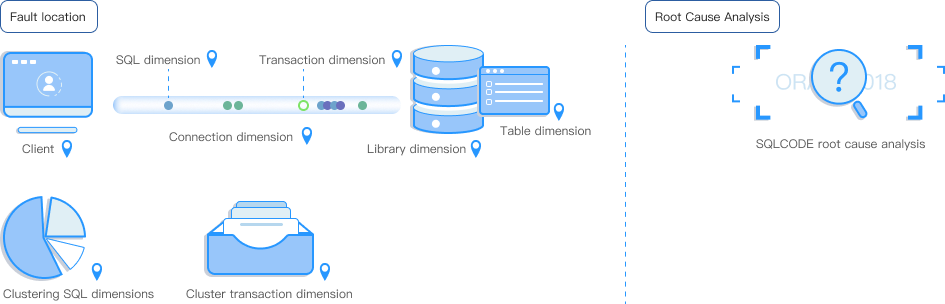
TPS low diagnosisDetermine whether the low TPS is caused by the database.Sqlcode classification analysisClassify and analyze the causes of SQL statement execution failure.Worst performing statement typesAnalyze the top 10 statement types that are slow to execute and affect the database.Worst performing statement analysisAnalyze whether the statement type of slow executing statements is slow.Channel uncommitted diagnosisAnalyze and count uncommitted transactions and similar transactions.Large transaction diagnosisThe addition, deletion and modification statements in a transaction affect the transaction analysis with a large number of rows.High frequency rollback transaction diagnosisAnalyze the transaction types with the highest rollback rate of top 5.Application anomaly diagnosisAfter database upgrade or migration, you can query the missing application IP and new application IP.Hot spot data diagnosisAnalyze hot data queued application transactions.Supercomputing diagnosis of large data setsAnalyze supercomputing statements that operate on large data sets - 4
- 5
- 6
-
- 01
- 02
Promotion EscortDetermine whether there are promotion activities and analyze them.Upgrade EscortDetermine whether the application is upgraded, monitor the resource changes and performance of the database when the application is upgraded, and evaluate whether the upgrade is risky. -
3
- 4
- 5
- 6
-
- 01
- 02
Security auditIdentify, record, store and analyze relevant information of safety related activities in the system.Development auditIdentify, record, store and analyze relevant information related to program development. -
3
- 4
- 5
- 6
monitor
Abnormal diagnosis
Campaign escort
Audit
Architecture Deployment

Relevant cases
/ Case introduction
With the widespread use of database in all walks of life, its importance is self-evident. At the same time, the industry also has a great demand for database monitoring.
This process must be accompanied by database monitoring tools. At present, such tools are also scarce.
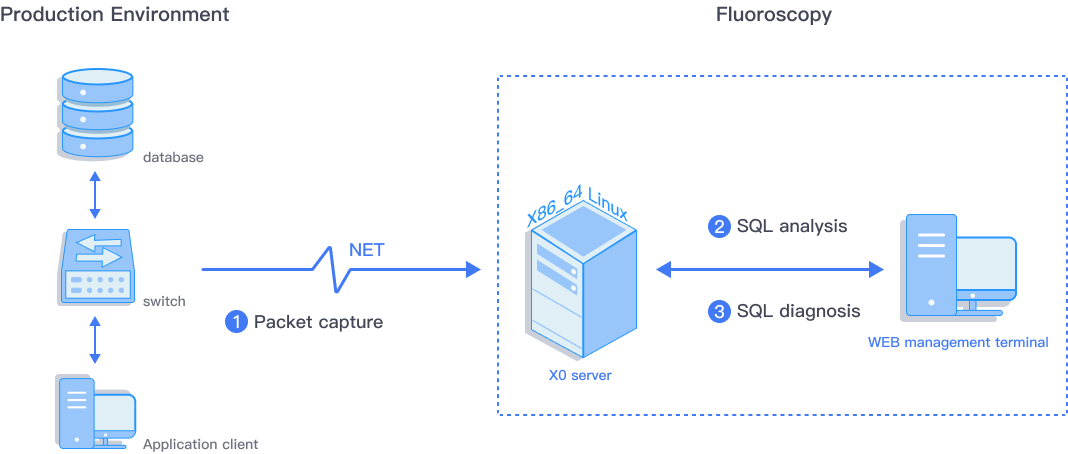
How to find a good database monitoring tool has become a hot topic for major companies.X0 perspective diagnosis tool provides a "God's perspective",
comprehensively analyzes and evaluates the operation status of the database through multiple dimensions, timely alerts the possible performance and other problems
of the database, and helps DBAs solve the thorny problems that can only be solved by historical experience. X0 is designed to liberate DBAs.
/ Project background
A joint-stock bank hopes to monitor the performance and resources of hundreds of DB2 / Oracle databases. With the increase of data volume and the complexity of application,
DBA is required to timely find the operation faults of the database, conduct root cause analysis, trace the causes of faults and solve the database faults in time.
/ Customer pain points
1.The deployment of hundreds of database monitoring systems is time-consuming and labor-consuming;
2.Maintenance cost is difficult to control;
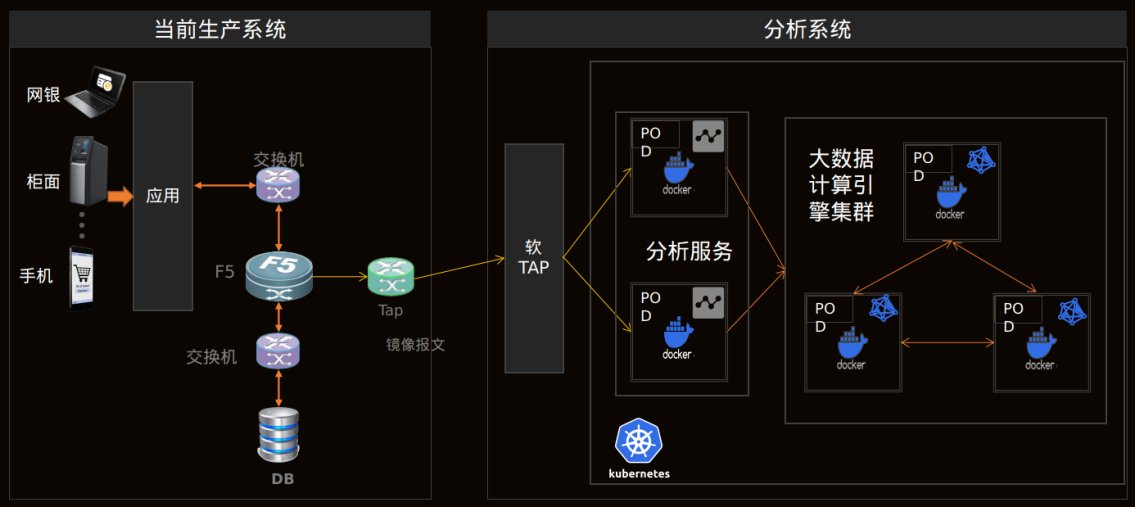
3.The consumption of system resources is difficult to control. / Solution 1. Flow control By deploying the soft tap tool on the packet capturing machine, preprocess the traffic of hundreds of databases imported from the tap port to the packet capturing machine, divert the traffic of the physical network card according to each database and distribute it to the virtual network card of the specific virtual bridge, process the traffic received on the virtual network card and forward it to the analysis machine,Then go to the virtual network card of the analysis machine to capture traffic messages according to the library, so as to realize the ability of traffic diversion according to the library.Thus, the x0 container on the analysis machine can capture packets according to the library, analyze and monitor the real-time state of the database.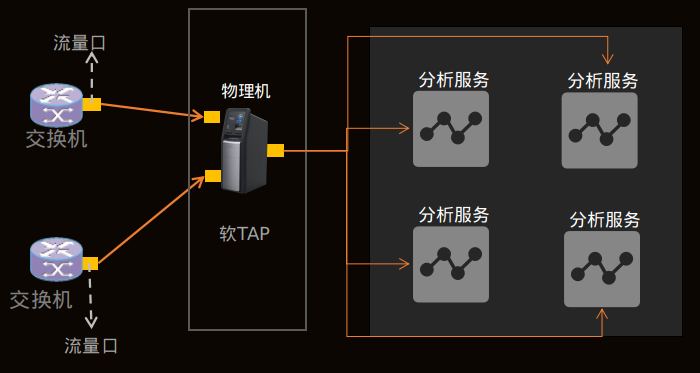 2. One click deployment
Container deployment based on kubernetes, and rapid deployment of hundreds of x0 perspective diagnosis systems through peripheral control,
as well as rolling upgrade, gray release and fallback of x0 version.
2. One click deployment
Container deployment based on kubernetes, and rapid deployment of hundreds of x0 perspective diagnosis systems through peripheral control,
as well as rolling upgrade, gray release and fallback of x0 version.
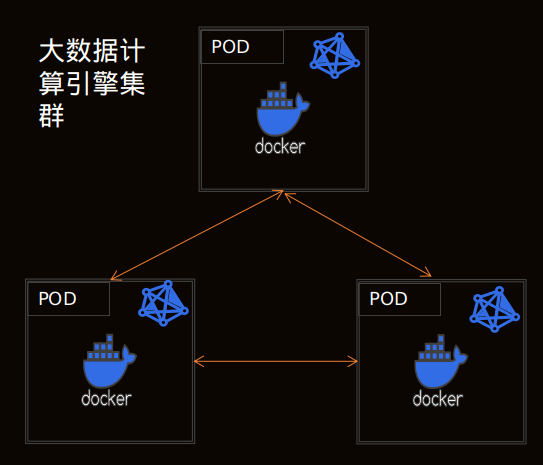
 3. Distributed storage
The cluster mode is adopted for storage. The data stored by the three master nodes form a full data set. Whenever a batch of data needs to be stored,
the cluster will automatically allocate these data to the appropriate nodes. Each master node is configured with slave nodes for component data backup.
3. Distributed storage
The cluster mode is adopted for storage. The data stored by the three master nodes form a full data set. Whenever a batch of data needs to be stored,
the cluster will automatically allocate these data to the appropriate nodes. Each master node is configured with slave nodes for component data backup.
 / Program advantages
1.One click deployment:Compared with traditional virtual machine or physical machine,
large-scale container deployment not only solves the dependence of development environment, but also provides great convenience for deployment and management;
2.Reduce resource consumption:Through traffic control, the situation of repeated traffic replication caused by repeated packet capture can be avoided,
and the effect of reducing resource consumption and packet loss rate is obvious;
3.Improve operation and maintenance efficiency:each database needs a set of x0 for monitoring,
and the large-scale deployment of x0 has been very time-consuming and energy-consuming.The containerization of x0 greatly improves the efficiency of deployment
and reduces the difficulty of operation and maintenance;
4.High availability of data:distributed storage is adopted to solve the problem of data inaccessibility caused by single point of failure,
which greatly improves the high availability of data.
/ Program advantages
1.One click deployment:Compared with traditional virtual machine or physical machine,
large-scale container deployment not only solves the dependence of development environment, but also provides great convenience for deployment and management;
2.Reduce resource consumption:Through traffic control, the situation of repeated traffic replication caused by repeated packet capture can be avoided,
and the effect of reducing resource consumption and packet loss rate is obvious;
3.Improve operation and maintenance efficiency:each database needs a set of x0 for monitoring,
and the large-scale deployment of x0 has been very time-consuming and energy-consuming.The containerization of x0 greatly improves the efficiency of deployment
and reduces the difficulty of operation and maintenance;
4.High availability of data:distributed storage is adopted to solve the problem of data inaccessibility caused by single point of failure,
which greatly improves the high availability of data.
2.Maintenance cost is difficult to control;
3.The consumption of system resources is difficult to control. / Solution 1. Flow control By deploying the soft tap tool on the packet capturing machine, preprocess the traffic of hundreds of databases imported from the tap port to the packet capturing machine, divert the traffic of the physical network card according to each database and distribute it to the virtual network card of the specific virtual bridge, process the traffic received on the virtual network card and forward it to the analysis machine,Then go to the virtual network card of the analysis machine to capture traffic messages according to the library, so as to realize the ability of traffic diversion according to the library.Thus, the x0 container on the analysis machine can capture packets according to the library, analyze and monitor the real-time state of the database.
2. One click deployment
Container deployment based on kubernetes, and rapid deployment of hundreds of x0 perspective diagnosis systems through peripheral control,
as well as rolling upgrade, gray release and fallback of x0 version.
3. Distributed storage
The cluster mode is adopted for storage. The data stored by the three master nodes form a full data set. Whenever a batch of data needs to be stored,
the cluster will automatically allocate these data to the appropriate nodes. Each master node is configured with slave nodes for component data backup.
/ Program advantages
1.One click deployment:Compared with traditional virtual machine or physical machine,
large-scale container deployment not only solves the dependence of development environment, but also provides great convenience for deployment and management;
2.Reduce resource consumption:Through traffic control, the situation of repeated traffic replication caused by repeated packet capture can be avoided,
and the effect of reducing resource consumption and packet loss rate is obvious;
3.Improve operation and maintenance efficiency:each database needs a set of x0 for monitoring,
and the large-scale deployment of x0 has been very time-consuming and energy-consuming.The containerization of x0 greatly improves the efficiency of deployment
and reduces the difficulty of operation and maintenance;
4.High availability of data:distributed storage is adopted to solve the problem of data inaccessibility caused by single point of failure,
which greatly improves the high availability of data.
Background Interface Display